Record-breaking Storm Season in 2020 Shows the Global Cost of Climate Change
Interested in this FREE data set?
The summer of 2020 has had its fair share of out of the ordinary weather events. From thunderstorms and lightning to cyclones, most parts of the world are experiencing extreme weather conditions. Storm forecasts are one way to mitigate the impact a storm has on an area both in the form of human safety and economics. Storms cause damage to an area’s vital infrastructure, they disrupt supply chains, cost billions of dollars each year in structural damages, and most importantly, lives are lost.
Forecasting a storm allows for measures to be put in place to lessen the impact of these extreme storms and save lives. Spire’s weather data paints an interesting picture of what’s happening with weather around the globe and provides insights into what might happen next.
With extreme weather events on the rise and the cost to rebuild storm affected areas numbering in the billions of dollars, we’re using our unique global observation network, powered by our radio occultation data, to track the increase in storms and atmospheric events. Below we look at hurricane visualizations, cyclones, and typhoons. It’s been a wild and destructive 2020 so far, storm forecasts are crucial to limiting the global economic impact and improving human-safety measures if these storms continue to get worse as we are now seeing with Hurricane Laura.
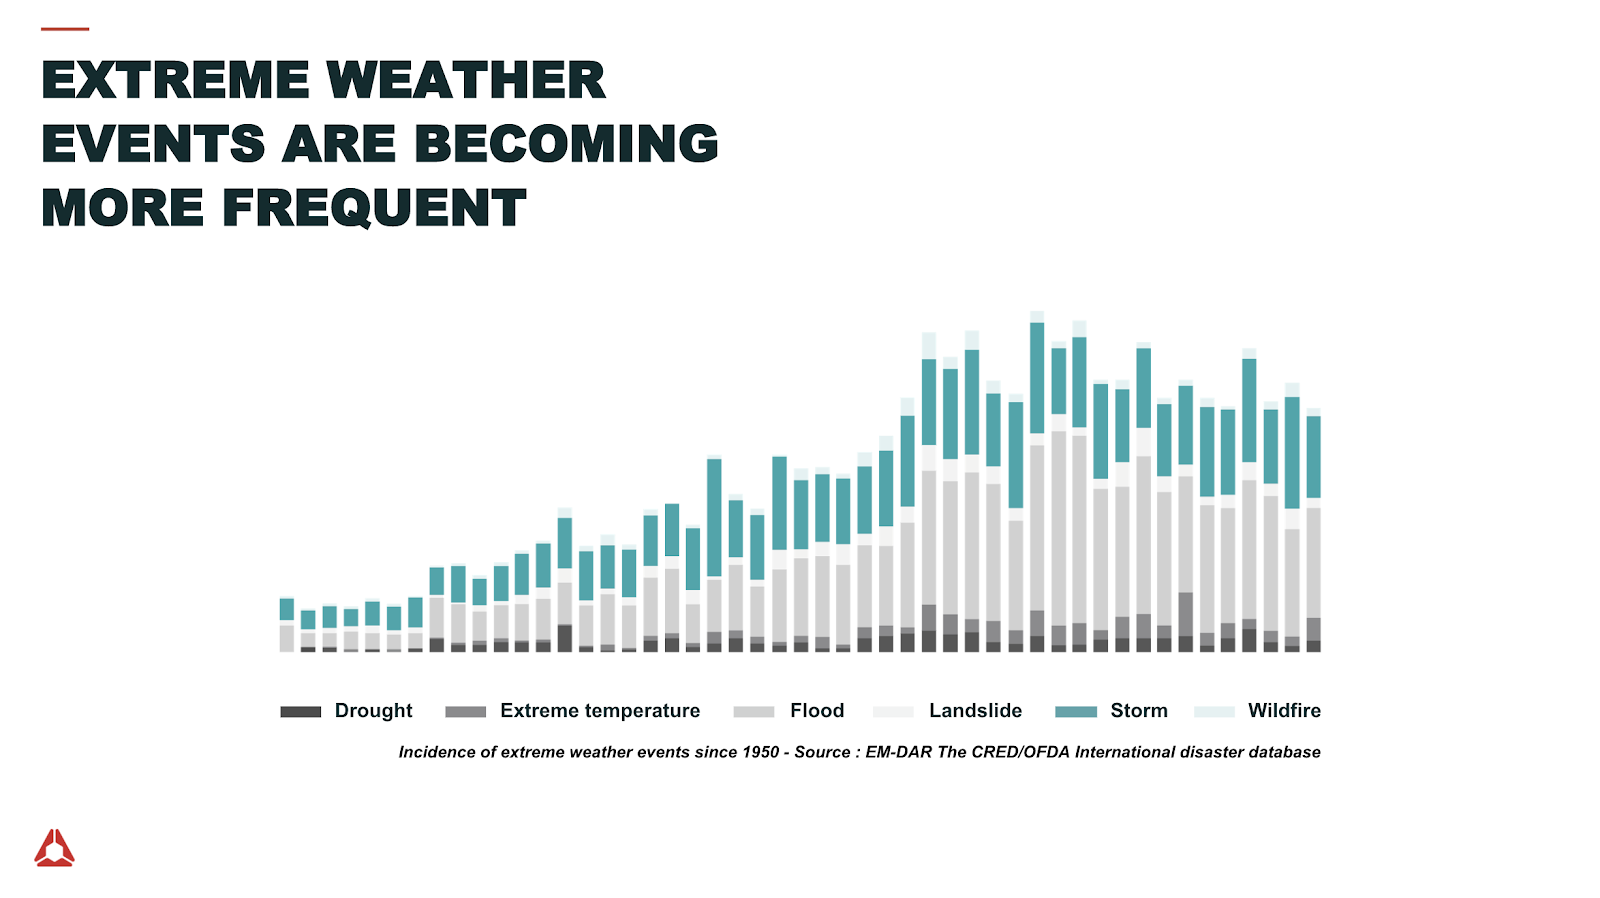
Climate change is the main driver behind the increase in extreme weather events and it’s important to distinguish between weather, short-term events that happen each day, and climate, which describes patterns and averages over a longer period of time.
Weather forecasts don’t predict long term trends and weather information has become critical to achieve sustainable development, run productive businesses, and manage day to day activities.
Accurate weather data is crucial to planning and it has to be visualized quickly in order to be an effective tool. Spire Weather provides Web Mapping Service (WMS) visualizations for each weather forecast and users can choose which time to show or play through all of them sequentially.
Below we look at a number of extreme recent weather events and use Spire Weather data to visualize the actual size and strength of each storm, starting with Hurricane Laura, which reached Category 4 in the early hours of Aug 27 2020 EDT.
Hurricane Laura
Hurricane Laura began as a tropical storm in the same general region as Tropical Storm Marco. Early morning, August 27, Tropical Storm Laura turned into a Category 4 hurricane pounding the Gulf Coast with ferocious 150 mph winds and torrential rains as it made it’s way over Southwestern Louisiana near the Texas border. As it made landfall in Louisiana at 6.am EDT, Laura’s winds diminished to 110 mph making it a Category 2 storm at the time this article was published. However, despite its weakening, the impact of Laura is still likely to be catastrophic and life threatening.
7-day Spire Weather forecast issued on Aug 24
Visualizing Hurricane Laura with Spire Global WMS
10-Meter Wind Speed wind barbs on top of Wind Gusts (m/s) in color
This visualization shows 2 separate wind data variables offered as Spire WMS layers. The wind barbs layer displays the direction and strength of winds at 10 meters above ground level. The layer with colors is showing wind gusts (also at 10 meters AGL), and the legend on the left shows how these colors map to speed in meters per second.
7-day Spire Weather forecast issued on Aug 24
Visualizing Tropical Storm Laura with Spire Global WMS
Mean Sea-Level Pressure (hPa) contour lines on top of Mean Sea-Level Pressure (hPa) in color
Air pressure is an important variable to consider when predicting and tracking tropical storms, since a rapid and drastic decrease in pressure typically indicates the approach of a storm. Here, the pressure differential between the center of the storm and the surrounding area is clearly shown by both the color and contour line styles of Spire’s WMS layers.
Laura is the largest storm the US has seen so far this year, and will likely affect many lives and incur a large global economic cost. We do not yet know the full extent of the damage caused by Laura, nor the incurred cost. However, we have been monitoring maritime activity in the Gulf Coast and you can see large fleets shifting rapidly overnight.
We spoke to 40 Geo who have been monitoring activity in the Gulf Coast closely:
“What we just witnessed with Hurricane Laura had a significant impact on oil and gas operations in the GOM (Gulf of Mexico). Laura came right down main street for oil producers in the gulf. The costs of moving rigs to safe waters, evacuating half of the manned platforms in the GOM and delayed production is a number that very few can comprehend, let’s just say it is a really, really big number.”
Keith Fraley – Co-Founder at 40Geo, LLC
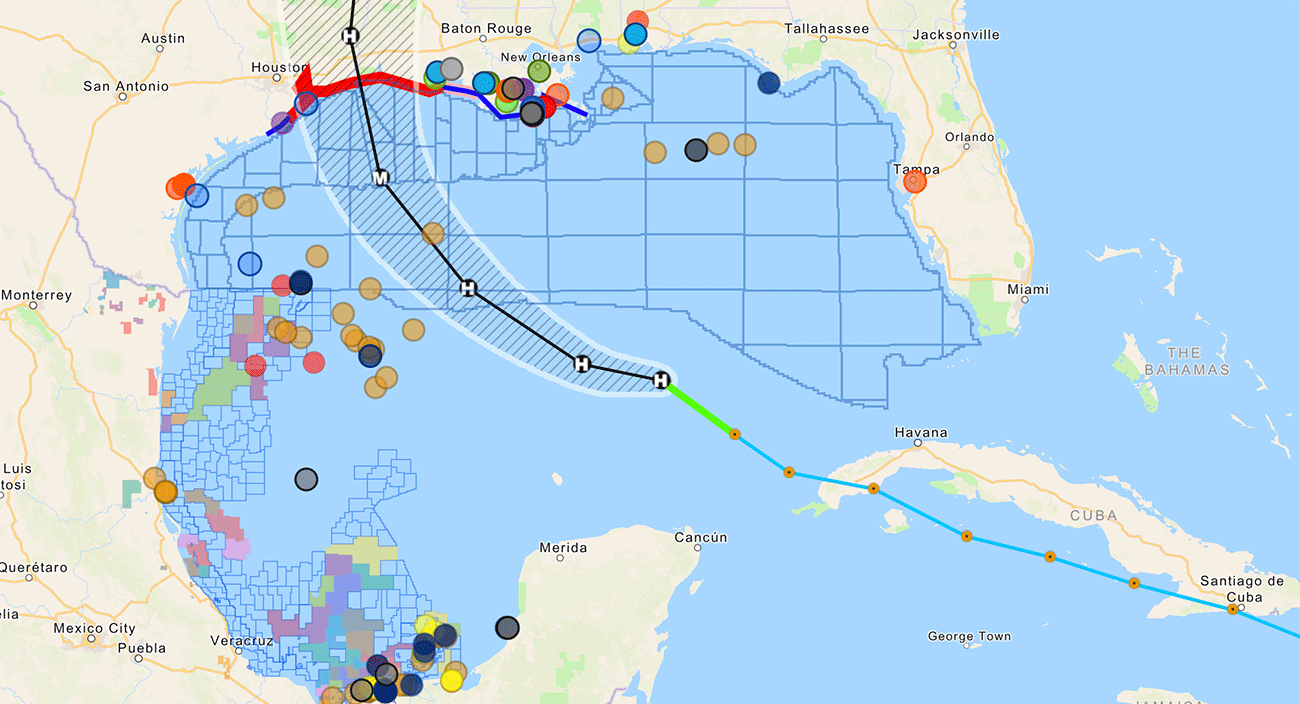
Gulf Coast 25 August 2020 4:51 pm EDT – source 40 GEO using Spire AIS data
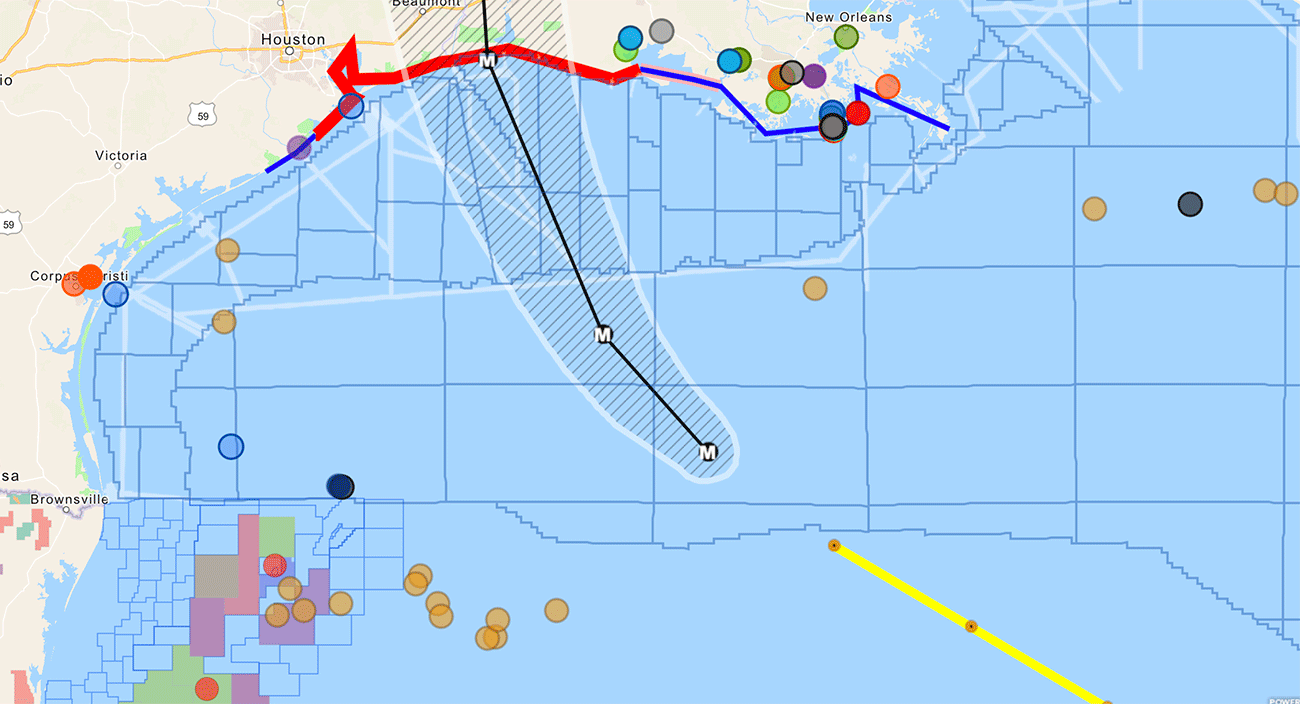
26 August 2020 9:41 AM EDT – source 40 GEO using Spire AIS data
In the images below we see a large rig right in Laura’s path (orange dot) having to be displaced overnight, this type of preventative action could cost up to $ 1M a day. We will take a deep dive into the impact of 2020 storm disruptions on the maritime industry in a future data story, so stay tuned.
Laura in comparison to the other global storm forecasts in 2020
Hurricane Isaias (July 30, 2020 – August 5, 2020)
Hurricane Isaias was a Category 1 hurricane that caused more than $4.2 billion in damages across the Caribbean and East Coast of the United States.
7-day Spire Weather forecast issued on July 30
Visualizing Hurricane Isaias with Spire Global WMS
10-Meter Wind Speed vector lines on top of Wind Gusts (m/s) in color
Similar to the wind visualization for Hurricane Laura from above, this visualization shows wind speeds and gusts during Hurricane Isaias. In this case, we use the vector lines WMS style for wind speed rather than the wind barbs style from above. Vector lines and wind barbs are two different methods for showing the wind direction and speed. This information is critical for predicting the path of a storm.
Other Storms in May 2020
Typhoon Vongfong (Philippines, May 10, 2020 – May 18, 2020)
Typhoon Vongfong impacted the Philippines in May 2020 and left destruction costing $31M.
This custom visualization of historical GRIB2 data shows precipitable water and significant wave height during Typhoon Vongfong. Precipitable water is defined as the depth of water in a column of the atmosphere, if all the water in that column were precipitated as rain. Here we can clearly see the path of the typhoon by observing the changes in the atmosphere’s water content and the ocean’s wave heights.
Cyclone Amphan (Bay of Bengal, May 16, 2020 – May 21, 2020)
Super Cyclonic Storm Amphan was a tropical cyclone that impacted Eastern India. Amphan is on record as the strongest tropical cyclone in the region since the 2007 storm season and was the first super cyclonic storm formed in the Bay of Bengal since 1999. This cyclone caused more than $13B in damages across the region.
Here is another custom visualization of historical GRIB2 data, this time focusing on Cyclone Amphan. When the path of a storm is largely unobstructed by land, sustained wind strength and duration can build up a large amount of energy beneath the ocean’s surface to form powerful swell waves.
Storm in April 2020
Cyclone Harold (South Pacific, April 1, 2020 – April 11, 2020)
Cyclone Harold was a tropical cyclone in the Solomon Islands, Vanuatu, Fiji, and Tonga. A Category 5 cyclone, Harold left massive destruction in its path, costing the region more than $123.5M in damages.
In addition to the variables already covered, this custom visualization of historical GRIB2 data for Cycle Harold shows Convective Available Potential Energy (CAPE) and Relative Humidity. The CAPE variable is offered through Spire Weather’s Thunderstorm data bundle. It can be used for predicting lightning activity as well as other storm characteristics.